V. APPLICATIONS
1. Data Considerations
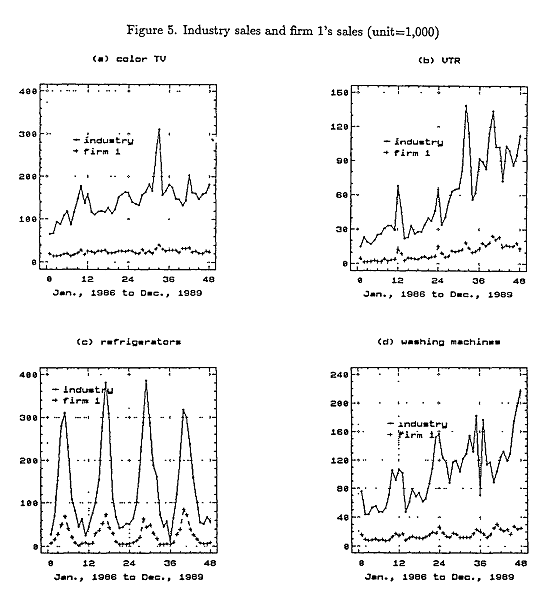
The presented model were applied to the firm sales of 4 electronic goods (color TV, VTR, refrigerators, washing machines). Since the vendors of these goods are 3 companies in Korea, one firm is denoted by firm I, the other two companies are grouped as firm 2, that is, firm 2 is competitor of firm 1. The plots of industry sales and firm l's sales for four products are given by Figure 5(a)-(d). As we can know from Figure 5, the market share of firm I is approximately 0.2. Some can say, since market share of other two firms are greater than that of firm I, it is desirable to try grouping using other approach but, unfortunately, the lack of data prohibits this trial.
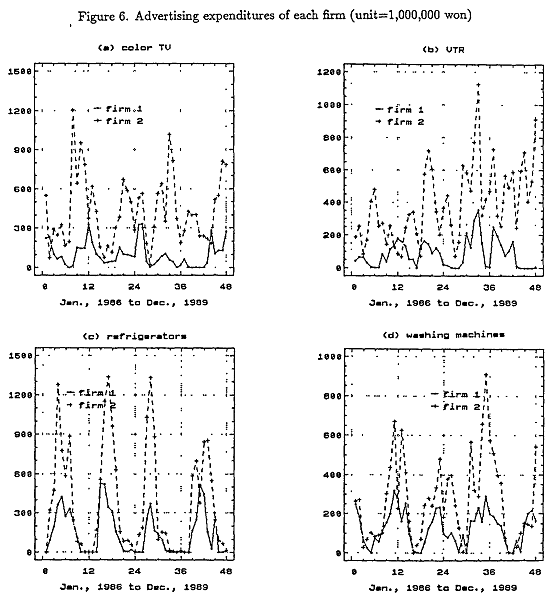
There may be several marketing mix variables such as distribution, sales promotion, price discount) and advertising, but only one marketing mix variable, advertising, is considered as a marketing mix variable, since there are no available data except advertising expenditures. Furthermore, since the information on the reference value of advertising spending rate is not available, the reference value of advertising expenditures is set to the average of advertising expenditures. Figure 6(a)-(d) show plots of advertising expenditures of each firm for four products.
To estimate parameters of the model, data from January, 1986 to December, 1988 are used, and sales from January to December, 1989 are forecasted.
2. Simplified Model and Fitting Procedures
Two simplifications are operated to apply the presented model to the real world. Since there are no prior information on the target market size and we are in a relatively short-term horizon, we can set the target market size to fixed value. Thus, it is assumed here that N(t) can be approximated by N. The second simplification is based on the premise that the effect of marketing efforts and word-of-mouth is much stronger in the adoption sales than that of the replacement sales. The direct experience borne out of trial is expected to be more influential in the replacement market than indirect experience which are made by marketing efforts of the marketers. Some support for this notion is provided by Smith and Swinyard(1982). Therefore, it is assumed here the brand loyal ratio πi(t) can be approximated by wi, the brand loyal ratio to firm i, if there is no marketer-controls, i = 1,2. This means that r = 0, i.e., marketer-controls can not manipulate the brand-choice decision of consumers during replacement of product. As a result, the 'full model' is simplified as follows,

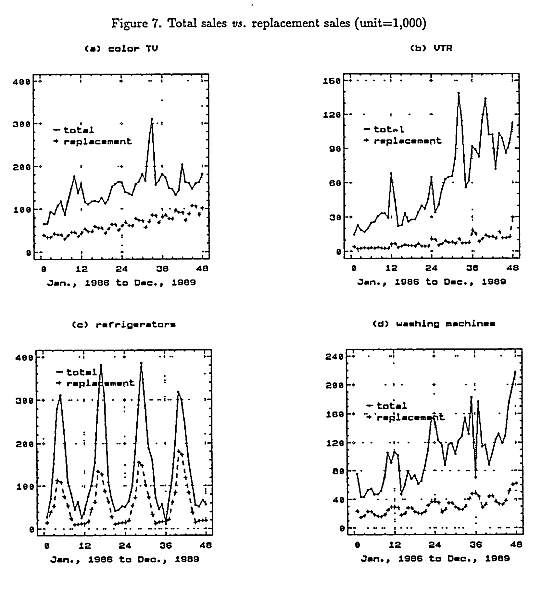
Final intuitive variables, the average service life of products, L and the shape paremeter, h which largely determines the rate of replacement - see Appendix B - are need determine. Since there are no prior information about the replacement sales and no available data to fit these variables in Korea, analogies of U.S. data - presented by Kamakura and Balasubramanian(1987) - has beed tried. The average service life of the product, L is set to 0.8 times to those of U.S. for all products. The shape parameter, h also obtained using same calculation utilized for obtaining the average service life. Since, in the case of VTR, there is no prior information even that of U.S., then the same values of color TV are exploted. For industry level, total sales - adoption sales plus replacement sales - vs. estimated replacement sales are plotted in Figure 7(a)-(d).
3. Estimation Results
If we see table 5, the target market size for color TV is approximately three times that of VTR. In the case of color TV this N is approximately equal to the total number of households in Korea. Thus we can say that ultimately, each household will have one color TV.
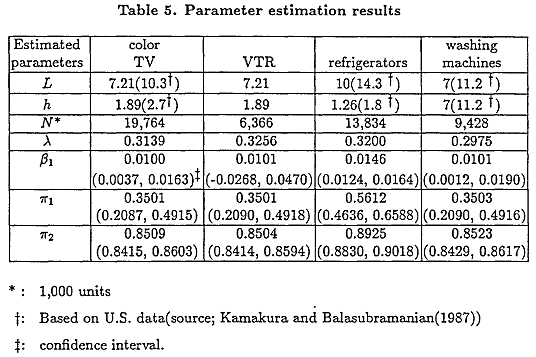
The carry-over rate of marketing efforts to induce trial of product are approximately 0.3. As can be seen following equation,
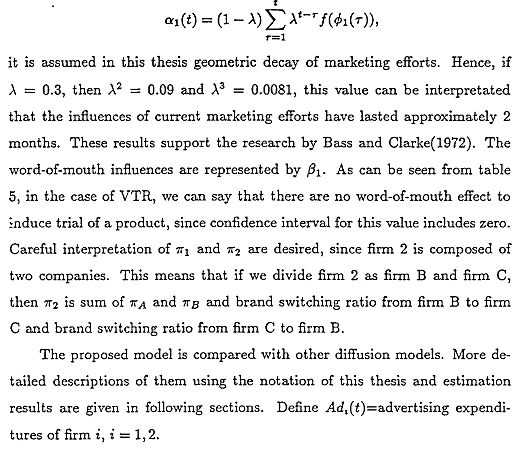

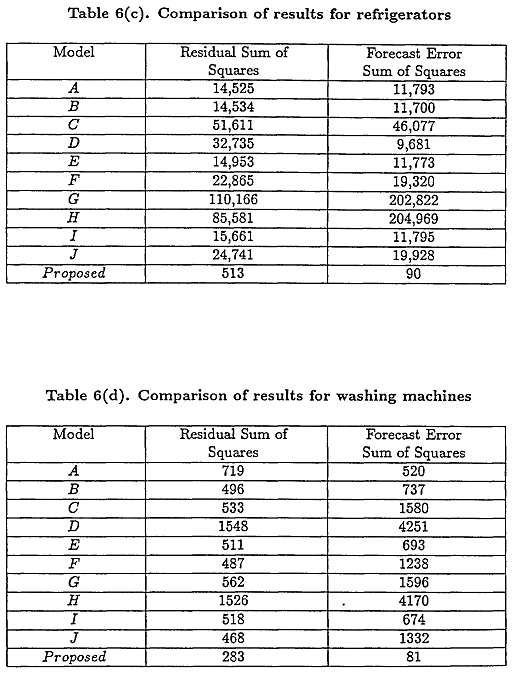
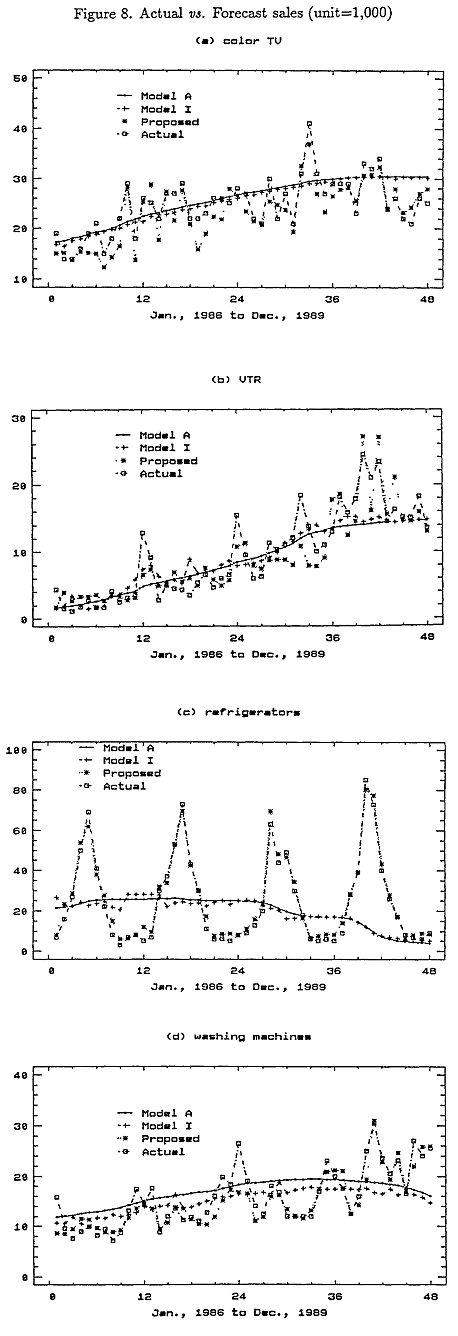
Table 6(a)-(d) give the fitted residuals and forecast errors for the proposed model and Model A to J for four products. For color TV and VTR, residual sum of squares are approximately equal for all models. In the case of VTR, the proposed model has larger residual sum. of squares than that of Bass model. However, if we compare the forecast accuracy, then we can clearly know the superiority of the proposed model. The proposed model reduce forecast error very much -2 to 10 times with comparison to Model A to Model J. Thus, we can say that although the proposed model has disadvantage of complexity, it has far better results for all products than those of other models, especially for forecast purpose. In the case of refrigerators, this superiority can clearly validated. Plots of actual vs. forecast sales for Model A, Model 1) and the proposed model are given in Figure 8(a)-(d).